EURUSD Monthly Chart with 5-EMA – Currently Not Extended

This post is a follow-on to the previous posts showing monthly charts with the 5-EMA. The charts for the USDCHF and GBPCHF pairs show current situations where price is extended away from the 5-EMA, and whether this is a decent clue for the risk of reversal remains to be seen. However, the yellow squares on the EURUSD chart definitely show that on many occasions when the EURUSD has been near a turning point on the monthly time frame, it has found itself extended away from the 5-EMA. The most recent example was 1 year ago with the EURUSD plunging to lows on the monthly chart in the low 1.2000’s high 1.1teens.

Image001

USDCHF Monthly Chart Well Extended from 5-EMA

The attached monthly chart of the USDCHF has plotted a 5-EMA along with yellow squares surrounding monthly price bars that failed to touch the 5-EMA. Bear in mind that the most recent price bar is in progress with the 5-EMA currently at 8570’s (subject to change by end of July).

Image001

GBPCHF Monthly Chart Extends Away from 5-EMA

Keeping with the theme about the monthly 5-EMA and the failure to touch it during the month, this blog post has a chart of GBPCHF.

Image001

Currency Pairs that are far away from their Monthly 5-EMA

Having a look at some forex pairs, there are pairs that have run quite a bit, so much that price has extended away from the 5-EMA by quite a few pips. This is an interesting market condition because in general, most forex pairs will at some point during the month come into contact with the  5-EMA on the monthly time frame (I estimate about 75% of the time). Obviously when a currency pair is trending very sharply it will sustain the kind of momentum that extends price away from the 5-EMA on the monthly and does not touch it. However, this condition of not touching the 5-EMA usually struggles to persist for an reasonable amount of time.

Here are some interesting currency pairs showing this dynamic

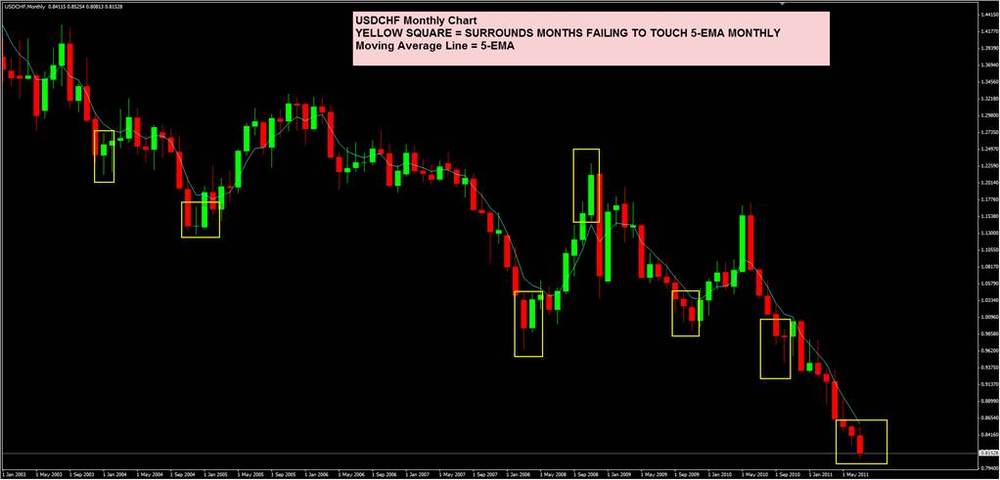
·         USDCHF has not touched the July monthly 5-EMA (0.8571) and it did not touch the 5-EMA during June. In the last couple of years, the USDCHF has had a few instances where it went 2 months in a row without touching the 5-EMA. One of those instances preceded a sharp upward reversal: October-November of 2009 failed to touch the 5-EMA and preceded a multi-month >1500-pip rally in USDCHF.

·         GBPCHF has not touched the July monthly 5-EMA (1.3866) and it did not touch the 5-EMA during June. The monthly chart has dropped about 11,800 pips in the last 3 years…..enough said.

Does it mean that these pairs are set to reverse any time soon?

No “signal” or technical condition guarantees success 100% of the time, but if you are trying to assign odds to the situation, it’s likely that the odds of a +1000-pip bounce are edging ahead of the odds of a -1000-pip tank from where the prices currently stand. Big downtrends can reverse quite suddenly and quite violently, a look at the monthly charts of AUDUSD and NZDUSD during late 2008 show that when a monthly price bar prints without touching the 5-EMA, the coming months can get quite hairy, planting the seeds for a sharp reversal

DIBS Chart Book for Week Ended July 15th 2011

The latest chart book with DIBS set ups highlighted is available. This past week featured a volatile breakout at the beginning of the week on the “risk off” theme, which was very good to early week DIBS breakouts. As the week progressed and the risk-off sell offs retraced, the action became choppier and less favourable to DIBS signals.

Enjoy,

FXdibs4pips


Did you know EURUSD has done a Gap Fill on Wednesday 2x in 2011?

Just this past week, the EURUSD rallied up to complete a gap fill of the Friday-Sunday gap on a Wednesday. That’s the 2nd time that EURUSD has done the gap fill on a Wednesday.

·         July Gap Fill Details – 1.4264 is the level for the gap fill based on Friday July 8th closing price, the gap fill is completed on Wednesday July 13th late in the day (more like Thursday Asia session I suppose).

·         April Gap Fill Details – 1.4429 is the level for the gap fill based on Friday April 15th closing price, the gap fill is completed on Wednesday April 20th early in the session (Asia trading).

EURUSD – liquidity gap fill to the downside in progress?

I like this chart of EURUSD for the last week, it shows a possible weekly time frame pin bar being formed on the 1H chart, the only thing EURUSD needs to do is finish the week near the current levels, which is by no means a certainty. The chart demonstrates some of the patterns found at the www.nobrainertrades.com web site, which is a great resource for forex traders. The spike base pattern is one that I like to keep my eyes peeled out for on 1H and 15m and 5m charts because it repeats a lot (http://www.nobrainertrades.com/2009/06/spike-base-pattern.html). In this environment where EURUSD is capable of trading like a yo-yo between EU debt concerns and the laundry list of USA concerns (debt ceiling, QE speculation/anticipation etc.) the pattern becomes that much more important since liquidity gaps crop up as a result of ad-hoc news (comments on wires by central bankers, bond auction results, rating agency downgrades, etc. etc.).

If EURUSD wants to print a pin bar for weekly chart this week, maybe on Friday it will try and print a pin bar too, perhaps by tagging the 1.4090s area (Missed Daily pivot from Tuesday)….

Image001

GBPUSD sitting at 2/3rds retracement of YTD Range

The GBPUSD today printed 1.5780 lows, getting very close to the 1.5750’s lows from January 2011, otherwise it has undercut the low printed in every other month so far in 2011.

·         What lies beneath? It looks like the 1.5690’s zone is a 78.6% retracement of the YTD range and also appears as a late-2010 resistance zone.

·         What lies above? Getting back up to the gap fill level at 1.6050s, from the NFP Friday in July.

When to look for a bounce? It looks as though today is headed for printing a pin bar and an up-day (i.e. blue candle in chart below, closing price > opening price), which could set the stage for a bounce back up. So far in 2011, the sell offs in GBPUSD with consecutive seller days (red bars in chart below) have often been halted and reversed after the daily chart has printed a buyer bar.

Image001

EURUSD – Resting at Half-Way Point of YTD 2000+ Pip Range

EURUSD’s sell off into the 1.3800’s zone today saw price pull back for the first time in 2011 to a daily 50% retracement level, at 1.3906.

·         What lies beneath? – 1.3660’s is 61.8% retracement of YTD range, but before that there is a 1.3750 low from March-2011.

·         What lies above? The 1.4260’s is the gap fill level from last week, basically this is the zone near the post-NFP lows on EURUSD

When is a good time to look for a bounce? Look for an Up Day on daily time frame. Notice that when EURUSD in 2011 has been selling off or pulling back in a sequence of seller days (red bars in chart below), that once that sequence is interrupted by an up-day (blue bars in chart below) then the following days often show a pattern of bouncing upward. That pattern is called “go with the flow” J  

Image003

EURUSD Sell Off Jacks Up Correlations – Typical “Risk-Off” Stuff

The sell off in the EURO across multiple currency pairs has shown the typical risk-off type of price behaviour as correlations have been jacked up across the various EURO pairs.

Having checked out the correlation matrix at the mataf site (www.mataf.net) for a few periods you can really see how the short term action in the EURUSD has changed a bit. I used the correlation matrix for the daily time frame set to a 30-period for recent price action and to a 90-period for a longer time window (roughly one calendar quarter) and here are some results 

Daily Correlations – EURUSD way up there with EURCHF and EURJPY Lately

  • EURUSD – EURCHF – short term correlation has been jacked up…..like…a lot!: The 30 day correlation stands at 82.7 versus 90-days at -2.2, that is a huge difference. The screenshots below also show that over much longer periods (30 and 90 weeks) the correlation is quite low.
  • EURUSD – EURJPY – short term correlation has jumped up: The 30 day correlation stands at 91 versus 67.2 for 90-days.
  • EURUSD – EURAUD – another short term correlation that has jumped up a lot:  The 90-day correlation for EURUSD/EURAUD is -14.4, so in that context the increase to a +67.8 for past 30 days looks pretty sharp. Looking at the table below you cal also see that EURUSD-EURAUD has shown a similar correlation level as EURUSD-EURCAD, another “commodity linked” pair.

The chart below shows the figures for the 30-period for Daily and Weekly

12-07-2011_11-37-48_euro_pairs_30period_correlations

The chart below shows the figures for the 90-period for Daily and Weekly

12-07-2011_11-37-48_euro_pairs_90period_correlations

What does this mean for trading the EURO Pairs in the near term?

  • EURO-related news dominating headlines = look for high probability opportunities where several Euro crosses appear to be in agreement. For example, a study of the 1H Chart on the EURJPY and EURCHF for the period from July 11th until London open on July 12th showed highly similar price pattern of decline and consolidation prior to the 8-AM London open. This type of configuration can provide that extra bit of help when looking at opening range breakouts.