Not All DIBS Are Created Equal – EURUSD Potential Exhaustion Gap Breakdown
May 20, 2011 Leave a comment
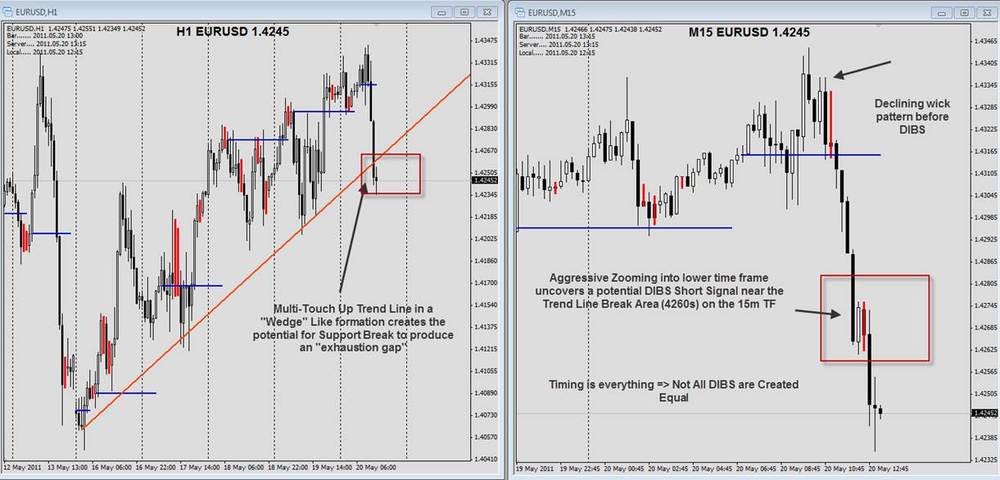
Today’s price action in the EURUSD offers a great lesson in the notion that “there is a time and place for everything”. If you missed the potential resistance fade short on the EURUSD at the 1.4340s area this morning, all was not lost. A little bit of perspective on the 1H chart showed that the rising wedge pattern with multiple touches of an ascending support-line created an interesting opportunity to aggressively zoom into the lower time frame (15m chart) and hunt for a possible DIBS (Daily Inside Bar Set Up) that offered the potential to exploit the possible volatile breakout of the trend line.
Chart on the Left shows 1H EURUSD: On this chart we can see a rising trend line providing support in a wedge like formation. With the trend line having established itself with multiple touches throughout the week, it was shaping up to be strong support. Therefore a breakout of this trend line had the potential to see a volatile breakout and possibly create an “exhaustion gap”. The exhaustion gap concept is a great one and worth investigating further at : http://www.nobrainertrades.com/2011/05/liquidity-gaps-and-spike-removals.html or by clicking on the Videos link on the top of this blog. Funnily enough, I was watching the Liquidity Gaps video while monitoring the EURUSD today, a pretty freaky coincidence.
Chart on the right shows 15m EURUSD: The 15m chart on the right shows a picture of the EURUSD zoomed into the red-squared area on the 1H chart, and what you can see is that as EURUSD sold off sharply during London session, it printed a potential bear-flag formation on the 15m time frame that included a DIBS bar (i.e. inside bar below the blue horizontal line = short signal on a break of the lows). As the 15m DIBS was broken, the price tanked about 20pips, easily covering a first profit target (Free Trade Target = “cover half position at 1:1 and see if the 2nd half can get lucky with a good run”.
There is a time and place for everything: I definitely am not a big advocate of trading every DIBS set up that comes my way on the 15m time frame. In the example of the chart above, my first port of call was the 30m time frame to see if there would be a DIBS signal bar (i.e. was looking for it on the 11:30-12noon UK Time candle but it didn’t happen), and then I drilled down into the 15m time frame. This was one of those instances where the 15m time frame ended up beating the 30m time frame to the punch, so to speak.
A Good DIBS is all about playing Range Expansion: At the time of the 15m DIBS signal bar appearing (1.4361 low and 1.4375 top), the EURUSD’s daily range was about 85pips, so there was plenty of “gas in the tank” in the context of it’s recent 180pip average daily range. On that front, the DIBS signal offered the ability to exploit range expansion on the day as well.
It’s nice when unscheduled news/developments help your trade signal: Although the scheduled newsflow calendar was relatively light during the session, there were developments in the fixed income markets (Greek debt yields, Spanish debt yields) that contributed to the strong downside momentum in EURUSD. It’s always helpful to have a nice looking technical set up (i.e. wedge/trend line break combined with DIBS signal bar) that coincides with some developments that are hitting market sentiment / fundamental expectations in favour of your trade direction.
It’s not just about the probability, it’s also about the potential: I won’t argue that playing a breakout of the DIBS short on the 15m chart and tucking the SL just above the highs is not without risk, but in this case it wasn’t just about how high a probability the set up had to offer, it was also about the potential gain it had to offer, it was also about the potential gain it had to offer and in this case the higher time frame wedge breakdown was the “450 pound marlin” that I was trying to boat with the teeny tiny 15m DIBS signal.
